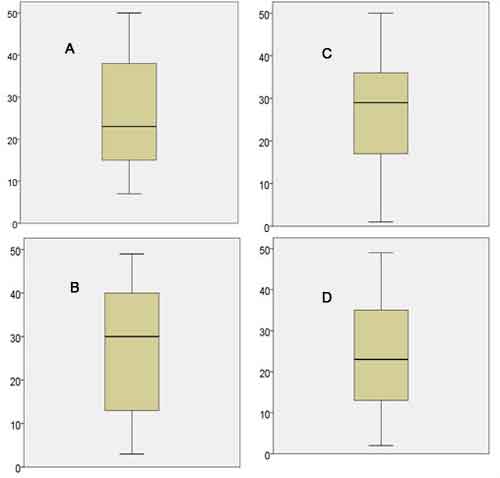
1. Which of the following boxplots correctly represents the data set shown below?
7, 8, 8, 11, 13, 14, 15, 15, 16, 17, 21, 23, 23, 24, 31, 35, 35, 35, 38, 38, 40, 45, 49, 50, 50
2. Given the parallel boxplots shown below, which of the following statements is true?
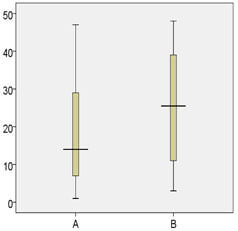
- The boxplot for data set A has a larger interquartile range and a larger median.
- The boxplot for data set B has a larger interquartile range and a larger median.
- The boxplot for data set A has a larger interquartile range and a smaller median.
- The boxplot for data set B has a larger interquartile range and a smaller median.
3. Given the double bar graph shown below, which of the following statements is true?
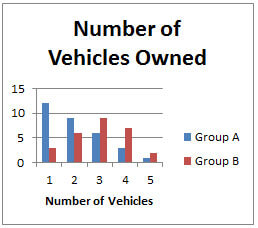
- Group A is negatively skewed, while Group B is approximately normal.
- Group A is positively skewed, while Group B is approximately normal.
- Group A is approximately normal, while Group B is negatively skewed.
- Group A is approximately normal, while Group B is positively skewed.
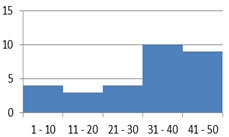
4. Which of the following data sets is represented by the histogram shown below?
- 6,7, 7, 8, 12, 13, 18, 22, 26, 27, 28, 31, 36, 36, 36,
36, 37, 38, 38, 38, 39, 41, 41, 41, 42, 42, 43, 43, 48, 49 - 2, 3, 4, 4, 8, 9, 10, 10, 11, 15, 19, 21, 21, 21, 21,
22, 24, 24, 25, 29, 31, 33, 40, 43, 45, 46, 48, 48, 49, 50 - 1, 2, 8, 8, 9, 9, 12, 13, 15, 15, 16, 17, 18, 19, 19,
21, 29, 31, 31, 35, 36, 38, 41, 42, 42, 45, 46, 47, 47, 49 - 1, 4, 4, 5, 10, 10, 10, 12, 12, 16, 20, 22, 23, 23, 25,
27, 31, 31, 37, 39, 40, 41, 41, 43, 45, 46, 48, 49, 49, 50
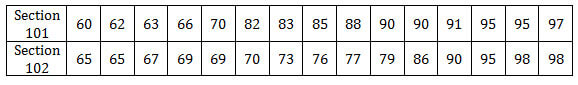
5. The statistics scores for Sections 101 and 102 are shown below. Which of the following statements accurately compare the center and variability of the sets of scores?
- The statistics scores for Section 101 show a greater center and variability.
- he statistics scores for Section 101 show a greater center but smaller variability.
- he statistics scores for Section 101 show a smaller center but greater variability.
- The statistics scores for Section 101 show a smaller center and variability.
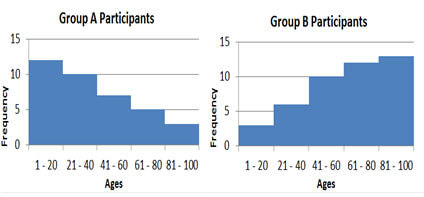
6. Given the histograms shown below, which of the following statements is true?
- Group A is negatively skewed and has a mean that is less than the mean of Group B.
- Group A is positively skewed and has a mean that is more than the mean of Group B.
- Group B is negatively skewed and has a mean that is more than the mean of Group A.
- Group B is positively skewed and has a mean that is less than the mean of Group A.
7. Given a normal distribution, which of the following best represents the area under the curve to the right of a z-score of 1.38?
- 0.03
- 0.08
- 0.12
- 0.15
8. Given ? = 18 and ? = 2, which of the following best represents the proportion of scores falling above 19?
- 31%
- 18%
- 41%
- 22%
9. Which of the following best represents the area under the curve of a normal distribution, falling between the z-scores of ?0.8 and 1.2?
- 62%
- 67%
- 72%
d. - 77%
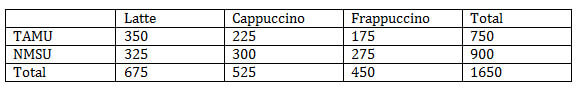
10. Given the table below, which of the following best represents the probability that a student is enrolled at TAMU or prefers lattes?
- 55%
- 60%
- 65%
- 70%
Answers and Explanations
1. A: The minimum and maximum values are 7 and 50, respectively. The median is 23, while the first and third quartiles are 15 and 38. The boxplot for Choice A correctly represents these five values.
2. B: The boxplot for data set B shows a larger range between the first and third quartiles. In addition, its median is approximately 25, which is higher than the median of data set A.
3. B: Data is said to be positively skewed when there are a higher number of lower values, indicating data that is skewed right. An approximately normal distribution shows an increase in frequency, followed by a decrease in frequency, of approximately the same rate.
4. A: The data set, shown in Choice A, correctly represents a frequency of 4 for the interval 1 – 10, a frequency of 3 for 11 – 20, a frequency of 4 for 21 – 30, a frequency of 10 for 31 – 40, and a frequency of 9 for 41 – 50.
5. A: The scores for Section 101 have a mean of approximately 81.1, with a standard deviation of approximately 13.2. The scores for Section 102 have a mean of approximately 78.5, with a standard deviation of approximately 12.0. Thus, the center and variability of scores for Section 101 are greater.
6. C: Group B is negatively skewed since there are more high scores. With more high scores, the mean for Group B will be higher.
7. B: Using a standard z-table, the area from the mean to z is shown to be 0.4162. This area should be subtracted from 0.5 in order to show the area to the right of a z-score of 1.38. Thus, the area to the right of the z-score is 0.0838, or approximately 0.08. A z-table, including the smaller portion of area under a curve may also be used. This area is reported as 0.0838.
8. A: The z-score may be represented as z=19-18/2 or z=1/2. Using a standard z-table, the area from the mean to z is shown to be 0.1915. Subtraction of this area from 0.5 gives 0.3085. Thus, the proportion of scores falling above 19 is approximately 31%. A z-table, including the smaller portion of area under a curve may also be used. This area is reported as 0.3085.
9. B: A standard z-table shows an area of 0.2881 between a z-score of ?0.8 and the mean. It also shows an area of 0.3849 between the mean and a z-score of 1.2. The sum of the two areas is 0.673. Thus, the area between the two z-scores is approximately 67%. Using a table that reports the mean to z, the two mean-to-z areas may be extracted and summed. You may also add the smaller portions and subtract the sum from 1.
10. C: The probability may be written as P(A or B)= 750 / 1650 + 675 / 1650 – 350/1650, which simplifies to P(A or B)=1075 / 1650 or approximately 65%.